Climate Data Recorded in or near the
Suwannee River Watershed
National Meteorological Network
 Automated Surface
Observing System (ASOS)
Automated Surface
Observing System (ASOS)

The National Weather Service (NWS), Federal Aviation Administration (FAA) and Department of Defense operate this network of 967 stations located throughout the United States (51 in Florida). The data generally available from ASOS stations includes hourly (and special) observations of air temperature, dew point, wind speed, wind direction, cloud cover, visibility, present weather, and precipitation. Via modem data can be obtained every minute (typically the most recent ~8 hours of observations are kept at the stations).
Additional Information:
- NWS ASOS home page
- FAA Automated Sensors home page.
- NCDC - Photographs of the wind exposure (360o) of 211 ASOS stations located in hurricane prone regions of the United States
 Automated Weather Observing
System (AWOS)
Automated Weather Observing
System (AWOS)

The FAA and various state agencies (particularly Aviation Divisions of state Departments of Transportation) operate this network of 900 stations located throughout the United States (20 in Florida). While data is generally available from 552 of these stations (4 in Florida), the data from the other 348 stations (16 in Florida) is currently only available via dialup modem (typically the most recent ~3 weeks of observations are kept at the stations). These stations typically provide 20-minute observations of air temperature, dew point, wind speed, wind direction, cloud cover, visibility, altimeter setting, present weather and precipitation.
Additional Information:
 NOAA/NWS Cooperative Observer
Program
NOAA/NWS Cooperative Observer
Program

The NOAA/National Weather Service oversees this network with 9765 participating cooperative observers located throughout the United States (176 in Florida). This network provides daily observations (7am local time) of maximum and minimum air temperature, precipitation, snowfall, and snow depth. Some stations also provide soil temperature, evaporation, and wind run. These data are archived at NOAA/NCDC.
Additional Information:
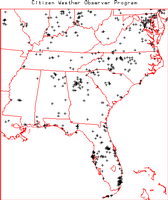 Citizen Weather Observer Program
(CWOP)
Citizen Weather Observer Program
(CWOP)

This 'network' is comprised of weather stations operated by the general public and reported by amateur radio operators around the world. All observations are collected by the NOAA/Forecast Systems Laboratory (NOAA/FSL) and are included as part of their Meteorological Assimilation Data Ingest System (MADIS). The network varies greatly in terms of data quality and completeness. Within the United States there are 1328 reporting stations (139 in Florida). The parameters reported vary by station, but typically include air temperature, relative humidity, wind speed, wind direction, barometric pressure, and precipitation.
Additional Information:
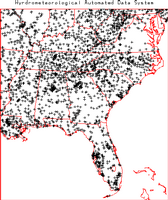 Hydrometeorological Automated
Data System (HADS)
Hydrometeorological Automated
Data System (HADS)

The NOAA Office of Hydrologic Development operates the HADS real-time data acquisition and data distribution system. HADS collects data from Data Collection Platforms (DCPs) operated by a number of federal, state, and local agencies throughout the US and a few nearby countries. The network currently includes 10079 observation locations (283 in Florida). The temporal resolution and parameters collected vary widely by network and station but can include a variety of meteorological and hydrologic parameters.
Additional Information:
 Long Term Ecological Research (LTER)
Network
Long Term Ecological Research (LTER)
Network

The LTER network was set up by the National Science Foundation to allow investigation of ecological processes at long time scales and over broad spatial scales. Each of the 19 LTER sites (1 in Florida) typically has at least one automated surface meteorological station. Many also have several meteorological stations, precipitation networks, and/or flux towers. The LTER site in Florida is the Florida Coastal Everglades LTER project.
Additional Information:
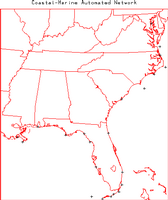 Coastal-Marine Automated Network
(C-MAN)
Coastal-Marine Automated Network
(C-MAN)

The National Data Buoy Center (NDBC) operates this network of 55 C-MAN stations with locations along coastlines throughout the US (12 in Florida). The network typically provides hourly observations of air temperature, barometric pressure, wind speed, wind direction, and wind gust. Some stations also provide observations of sea water temperature, water level, waves, relative humidity, precipitation, and visibility.
Additional Information:
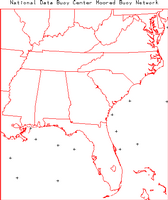 National Data Buoy Center (NDBC)
Moored Buoy Network
National Data Buoy Center (NDBC)
Moored Buoy Network

The NDBC operates this network of 77 moored buoys with locations throughout the US coastal regions (6 off the coast of Florida). The network typically provides hourly observations of air temperature, dew point, water temperature, barometric pressure, wind speed, wind direction, wave height, wave period, and swell.
Additional Information:
- National Data Buoy Center
- Instrument Requirements and Standards for the NWS Surface Observing Programs (Land) (203KB pdf)
State and Local Surface Meteorological Networks
 SRWMD WARN Rainfall Monitoring
Network - Observer Network
SRWMD WARN Rainfall Monitoring
Network - Observer Network
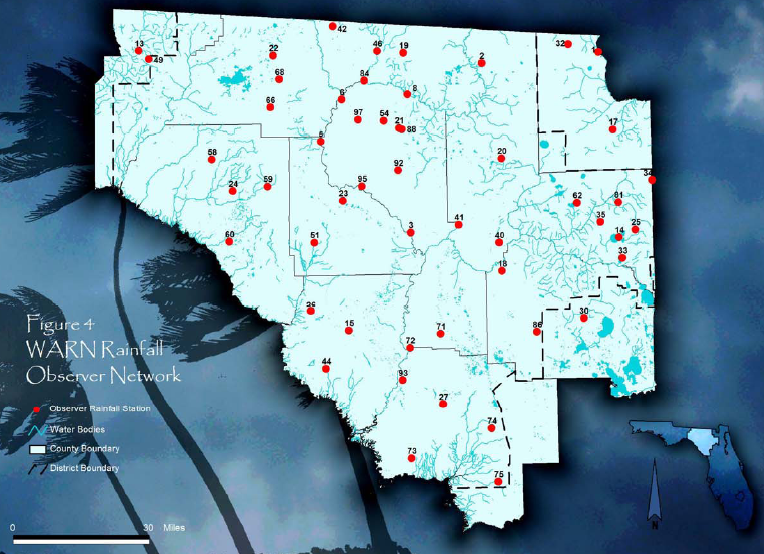
Data is collected from 54 monthly rainfall stations (Figure 4 and Table 4A). Twenty-two of the daily stations are at Division of Forestry (DOF) towers, 13 are National Oceanic and Atmospheric Administration (NOAA) stations, 6 are at Department of Agriculture and Consumer Services (DACS) inspection stations, 5 are at Florida Park Service (FPS) stations, and 11 are private stations.
Additional Information:
 SRWMD WARN Rainfall Monitoring Network - Automated Network
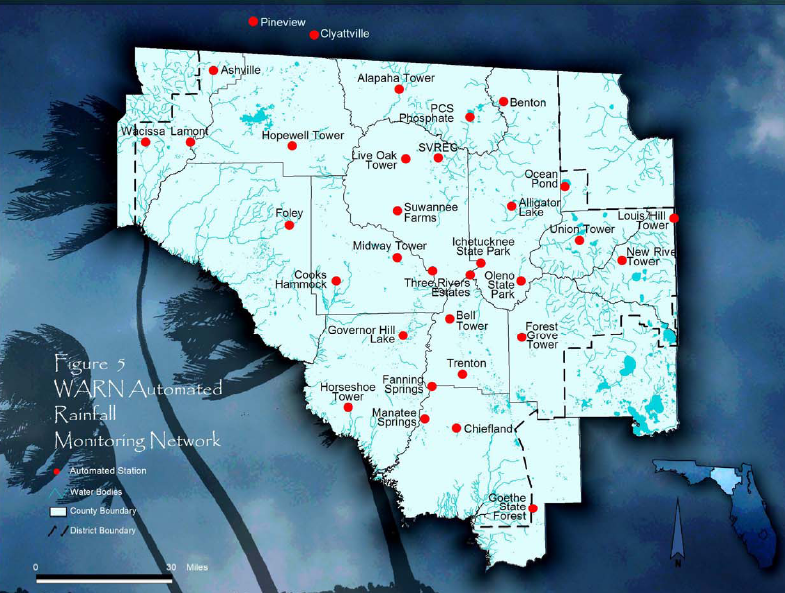
The District has installed an automated rainfall-monitoring network to supplement the river level flood forecast network. To date, the District has installed 31 tipping bucket rain gages at various locations District-wide (Table 4B and Figure 5). Data from these gages can be accessed in near-real-time on the District's website and are provided to the National Weather Service (NWS) for use in flood-forecasting.
Additional Information:
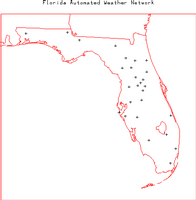 Florida Automated Weather Network
(FAWN)
Florida Automated Weather Network
(FAWN)

The University of Florida Institute of Food and Agricultural Sciences operates this network of 27 stations located throughout the state of Florida. There are plans for the network to be expanded to 32 stations. The network provides 15-minute observations of air temperature (at 2, 6, and 10 ft), relative humidity, wind speed, wind direction, solar radiation, soil temperature (at 10 cm depth), and precipitation.
Additional Information:
 Georgia Automated Environmental Monitoring Network
The Georgia Automated Environmental Monitoring Network was established in 1991 by the College of Agricultural and Environmental Sciences of the University of Georgia. The objective of the AEMN is to collect reliable weather information for agricultural and environmental applications. Each station monitors air temperature, relative humidity, rainfall, solar radiation, wind speed, wind direction, soil temperature at 2, 4, and 8 inch depths, atmospheric pressure, and soil moisture every 1 second. Data are summarized at 15 minute intervals and at midnight a daily summary is calculated. A microcomputer at the Georgia Experiment Station initiates telephone calls to each station periodically and downloads the recorded data. The data are processed immediately and disseminated via the world wide web.
Additional Information:
 USDA-ARS Southeast Watershed
Research Laboratory
USDA-ARS Southeast Watershed
Research Laboratory
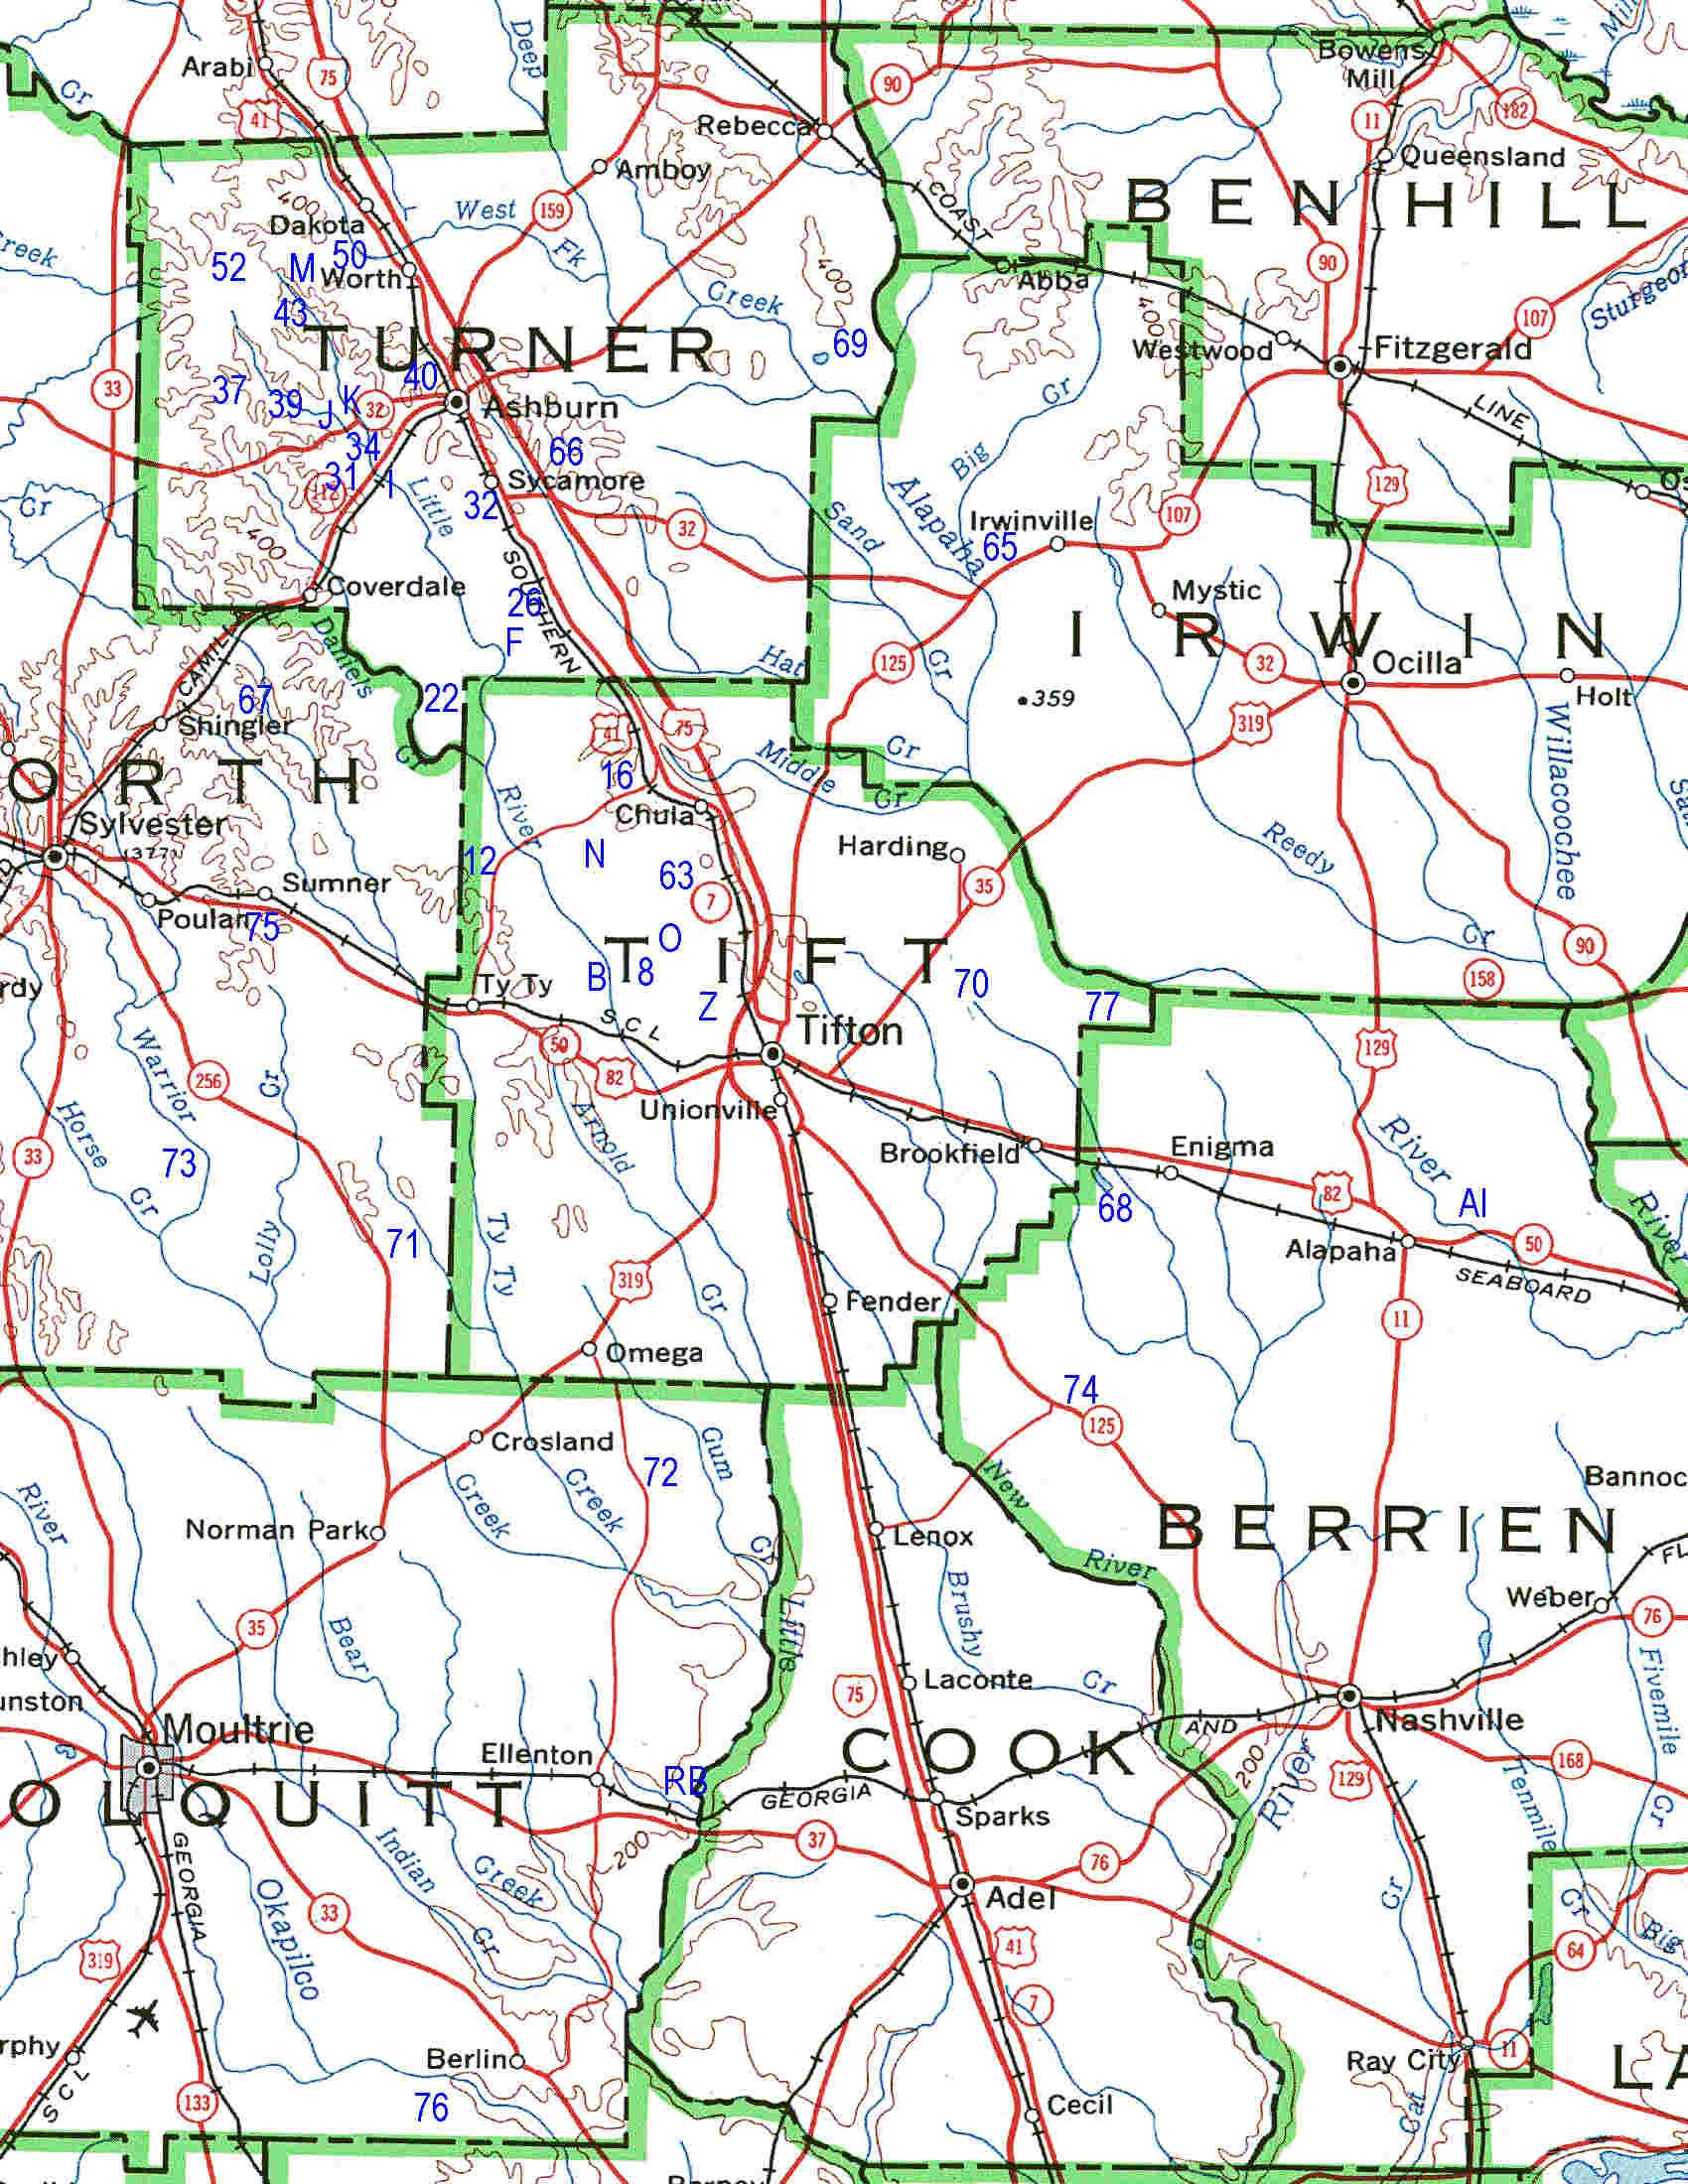
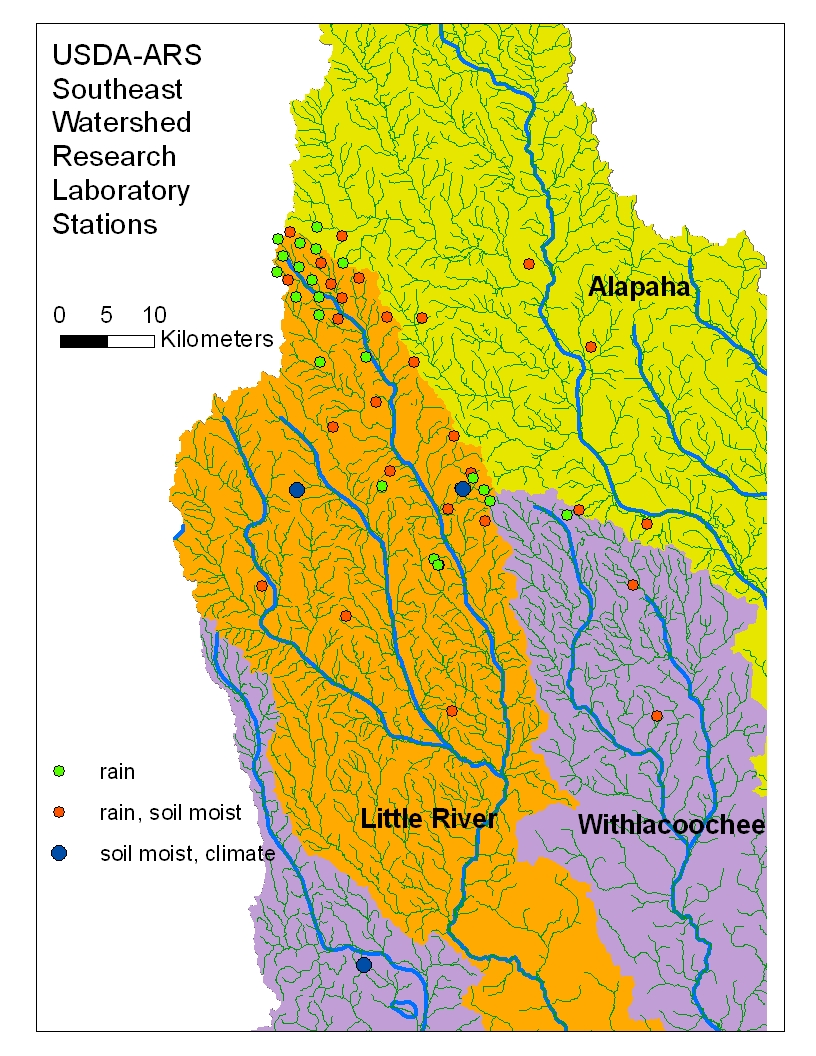
The 129 mi2 (334 km2) Little River Watershed near Tifton, Georgia was selected as the principal research watershed for the Southeast Watershed Research Lab in 1967. The Little River Watershed is typical of the heavily vegetated, slow-moving stream systems. The types of data collected on the watershed include stream gage, rainfall (rain gages), and groundwater measurements and samples. The 129 mi2 (334 km2) main watershed includes seven sub-watersheds ranging in size from 1 to 44 mi2 (3 to 115 km2). Stations on the map to the right are represented by the blue numbers.
Additional Information:
- Station map
- Little River station information
- Southeast Watershed Research Laboratory Watershed Monitoring Network
 FDOT
FDOT
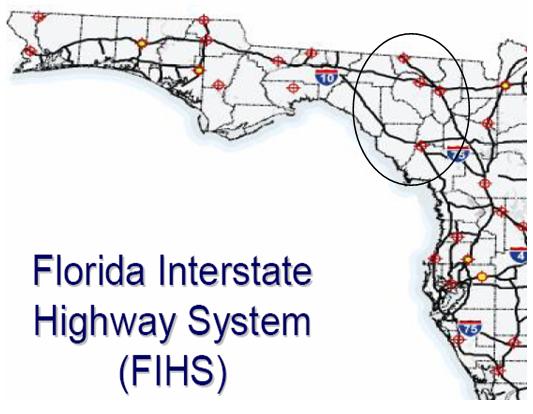
Advanced Weather Info Systems- The Florida Department of Transportation (FDOT) Microwave Communications System consists of 71 microwave paths along Florida's Interstate road system and the Florida Turnpike. The system provides voice and data connectivity for the FDOT and Florida Highway Patrol (FHP) facilities that are co-located with the microwave installations. The integrity of the microwave transmission is important for distress and emergency operations along Florida's highway system. Investigating potential disruptions from weather factors is a step toward better understanding and better reliability of the emergency communication system
Additional Information:
- Final Report for Road Weather Info System (3.84MB pdf)
Precipitation and Radar Networks
 NOAA/National
Centers for Environmental Prediction (NCEP) Hourly Precipitation Data
NOAA/National
Centers for Environmental Prediction (NCEP) Hourly Precipitation Data

NOAA/NCEP routinely develops a National Multi-sensor Hourly Precipitation Analysis (Stage II) data set from hourly radar precipitation estimates and from hourly gage reports. The gage data includes hourly observations from ~4000 gages across the US (110 in Florida) collected by the NOAA River Forecast Centers and sent to NCEP.
Additional Information:
 NOAA/NWS Cooperative Observer
15-minute Precipitation Network
NOAA/NWS Cooperative Observer
15-minute Precipitation Network

The NOAA/NWS routinely collects 15-minute observations of precipitation from Fisher-Porter and Universal rain gages operated by 2777 cooperative observers located throughout the US (49 in Florida). These data are archived at NOAA/NCDC as data set TD 3260.
Additional Information:
 Weather Surveillance Radar 1988
Doppler (WSR-88D) Network (NEXRAD)
Weather Surveillance Radar 1988
Doppler (WSR-88D) Network (NEXRAD)

The NOAA/NWS and the Department of Defence operate this network of 143 WSR-88D radars across the contiguous US (7 in Florida). The Level II data are the three meteorological base data quantities (reflectivity, mean radial velocity, and spectrum width) and are recorded at all NWS and most DOD sites. Level II data are then processed in order to create a number of meteorological analysis products known as Level III data. Level III data are recorded at the NWS sites. The Level III products included base reflectivity, base spectrum width, base velocity, composite reflectivity, echo tops, velocity azimuth display (VAD) wind profile, vertically integrated liquid (VIL), 1-hour precipitation, storm total precipitation, hail index overlay, mesocyclone overlay, severe weather probability overlay, storm structure, storm tracking information overlay, and tornadic vortex signature overlay. All Level II and III data are archived at NOAA/NCDC.
Additional Information:
Radiation and Flux Networks
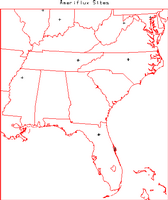 Ameriflux Network

The Ameriflux network consists of 54 sites conducting long-term measurements of CO2, water and energy fluxes throughout the US (4 in Florida). The typical observational frequency is 30 minutes. The parameters measured at each site vary, but Ameriflux has defined a core set of parameters that most sites collect, including fluxes of CO2, energy and water, basic meteorological and radiation parameters, and soil temperature and moisture.
Additional Information:
Soil Moisture Networks / Evapotranspiration
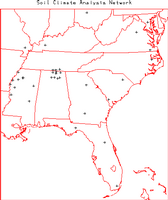 Soil Climate Analysis Network
(SCAN)
Soil Climate Analysis Network
(SCAN)

The SCAN is operated by the United States Department of Agriculture (USDA) Natural Resources Conservation Service (NRCS). The network provides hourly observations of air temperature, relative humidity, wind speed, wind direction, solar radiation, precipitation, barometric pressure, snow water content, snow depth, soil temperature (at 2, 4, 8, 20, and 40 cm depths), and soil moisture (at 2, 4, 8, 20 and 40 cm depths). The 80 SCAN stations are located across the US in primarily agricultural regions (3 in Florida).
Additional Information:
- Soil Climate Analysis Network
3 only 1 site in Wakulla (not recording now), and 1 in Sellers Lake and 1 in Everglades  In
GA, the Automated Weather Data network
In
GA, the Automated Weather Data network
National Soil Moisture Network - Pat Welsh has heard about it. I cannot locate information.
Private network "all over FL" to subscribe to (for citrus growers…) In addition to soil moisture monitoring, growers can monitor the temperature, rainfall, and evapotranspiration (ET) in their groves using Adcon's weather stations.
 USGS Evapotranspiration
Two weather stations for measuring daily evapotranspiration rates have been installed in the Suwannee River watershed (G.Mahon, USGS). The stations were installed to provide quantitative estimates of actual evapotranspiration at sites representing land cover types occurring in the Suwannee River Water Management District. The sites are part of a larger network of evapotranspiration weather stations that will ultimately used to help estimate evapotranspiration over peninsular Florida using remotely sensed data.
Where: One station was installed on a tower above a stand of young longleaf pine trees, at latitude 30 degrees 30 minutes 24 seconds north and longitude 83 degrees 11 minutes 49 seconds west. The other station was installed over an improved pasture (hayfield) at latitude 30 degrees 18 minutes 20 seconds north and longitude 82 degrees 53 minutes 56 seconds west.
What: The instruments at both sites allow for the use of the energy-budget variation of the eddy correlation method to estimate actual evapotranspiration. These instruments include a 3-dimensional, sonic anemometer operating at 8 Hz (for measuring a 3-dimensional wind vector), a krypton hygrometer (for measuring water vapor density), a pyranometer (for measuring incoming sun plus sky radiation), two net-radiometers (for measuring incoming minus outgoing radiation), as wells as sensors for measuring air temperature and relative humidity, soil temperature, soil heat flux, soil moisture content, and rainfall rate.
When: Both sites have been in operation from June 2002 to the present.
10 year Evapotranspiration Dataset
Jennifer Jacobs, University of New Hampshire
The updated AFSIRS climate data were used to generate 30 years of daily climate data at 368 locations covering the state of Florida. These locations are spaced at a 20-km resolution. The database was generated using the GWRAPPS climate interpolation utility.
The 1970-1999 climate database includes
daily ET data generated from
nine stations used in Task 9a and the 80 daily precipitation stations
used in
Task 9b. See full report (67KB pdf).
10 year daily reference ET based on Land Use, GOES satellite solar radiation to get gridded data - 2km, 15 min product. Dave Kurtis processes; has contract with all water management districts.
Upper Air Networks / Air Quality
NOAA/NWS Radiosonde Network Low Vertical Resolution Data
The NOAA/NWS typically releases
radiosondes twice per day at  0000 and 1200 UTC at 69 locations
throughout the US (5 in Florida). During special weather situations the
NWS can request to release additional radiosondes at off-times (e.g.
1800 UTC). The low resolution data is sent out over the Global
Telecommunications System (GTS) and provides mandatory and significant
level observations of pressure, altitude, temperature, dew point, wind
speed, and wind direction. There are 3 types of radiosondes utilized
within the US network, Vaisala, VIZ (or Sippican), and Microsonde. These
data are archived by NOAA/NCDC and other organizations.
0000 and 1200 UTC at 69 locations
throughout the US (5 in Florida). During special weather situations the
NWS can request to release additional radiosondes at off-times (e.g.
1800 UTC). The low resolution data is sent out over the Global
Telecommunications System (GTS) and provides mandatory and significant
level observations of pressure, altitude, temperature, dew point, wind
speed, and wind direction. There are 3 types of radiosondes utilized
within the US network, Vaisala, VIZ (or Sippican), and Microsonde. These
data are archived by NOAA/NCDC and other organizations.
Additional Information:
NOAA/NWS Radiosonde Network High Vertical Resolution Data
The same radiosonde locations
mentioned in the previous data set also provide a 6-second vertical
resolution data set that provides observations of pressure, temperature,
altitude, relative humidity, and azimuth and elevation angles. UCAR/JOSS
has developed software to derive 6-second vertical resolution winds from
the angle data. These data are archived by NCDC and UCAR/JOSS.
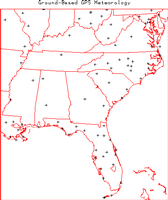 Ground Based Global Positioning
System (GPS) Meteorology Demonstration Network (GPS-MET)
Ground Based Global Positioning
System (GPS) Meteorology Demonstration Network (GPS-MET)

The NOAA/FSL ingests data from 323 GPS locations around the US operated by many different agencies (23 in Florida). Typically each location provides 30-minute observations of integrated precipitable water along with a number of surface meteorology parameters (air temperature, relative humidity, barometric pressure, etc).
Additional Information:
- GPS-MET
- GPS-MET
sites in Florida now are about 35 of the 50 projected sites.
See: GPS-Met sites (275KB ppt)
 EPA Air Quality Data
Air quality index (ozone). (Particle pollution data not avail for the Suwannee Watershed)
Additional Information:
Climate Models
see also NOAA National Operational Model Archive and Distribution System
NCEP Stage IV analysis
Mosaicked into a national product at NCEP, from the regional hourly/6-hourly multi-sensor (radar+gauges) precipitation analyses (MPEs) produced by the 12 River Forecast Centers over CONUS. Some manual QC done at the RFCs. Mosaic done at NCEP within an hour of receiving any new hourly/6-hourly data from one or more RFC.
 What is available in Stage IV:
Analysis on the 4km HRAP grid: ST4.yyyymmddhh.xxh.Z, where xx (=01,06 or 24) is the accumulation period and yyyymmddhh is the ending time of the accumulation period.
- Hourly analysis: from the hourly MPEs sent by the RFCs
- 6-hourly analysis: from the 6-hourly MPEs sent by the RFCs
- 24-hour (12Z-12Z) analysis: summed up from the 6-hourly Stage IV
Additional Information:
 High resolution real-time Florida analysis
Applied Meteorology Unit (AMU) entities, comprised of personnel from the Melbourne, FL National Weather Service (NWS) Weather Forecast Office (WFO MLB) AMU, the NWS Spaceflight Meteorology Group (SMG) in Houston, TX, and ENSCO, Inc.), implemented a Local Data Integration System (LDIS) at WFO Melbourne and SMG Houston between late 2000 and early 2001. This effort was undertaken to integrate the various data sets in proximity to the Kennedy Space Center (KSC) and east-central Florida, and to generate products that may enhance short-range (less than 6-hr) forecasts. LDIS analyses allow forecasters to quickly examine many disparate data sets within a single framework, to assist in assessing local weather changes in a high temporal and geographic resolution. (from National Weather Service Weather Forecast Office - Melbourne, FL )
Additional Information:
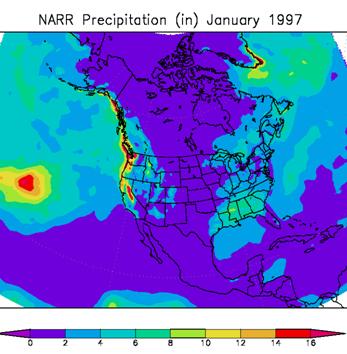 North American Regional Reanalysis (NARR)
The NCEP North American Regional Reanalysis (NARR) assimilates a great deal of observational data. Much of the data was the same as used as in the NCAR/NCEP Reanalysis, hereafter referred to as the Global Reanalysis (GR). This dataset includes temperatures, winds, and moisture from radiosondes, as well as pressure data from surface observations. Also included in this dataset are dropsondes, pibals, aircraft temperatures and winds, and cloud drift winds from geostationary satellites.
In addition to the above list, a major component of the NARR is the assimilation of precipitation. The precipitation dataset comes from a variety of sources.
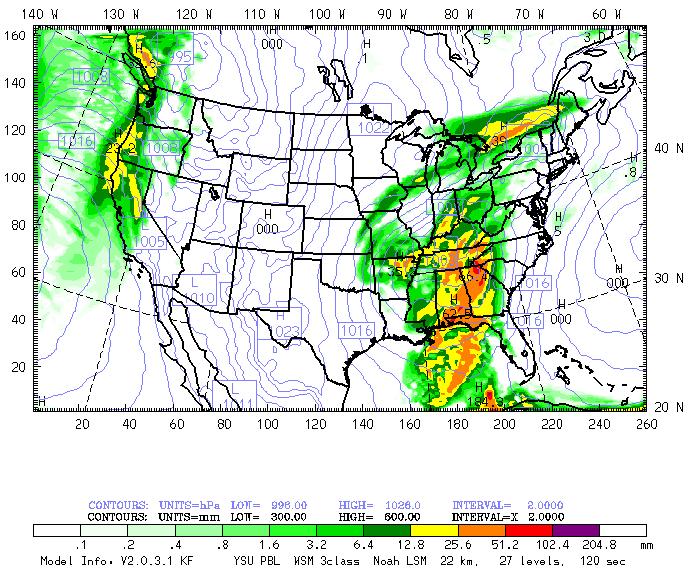 Weather Research and
Forecast (WRF) Model
Weather Research and
Forecast (WRF) Model
The Weather Research and Forecast (WRF) Model is a next-generation mesocale numerical weather prediction system designed to serve both operational forecasting and atmospheric research needs. It features multiple dynamical cores, a 3-dimensional variational (3DVAR) data assimilation system, and a software architecture allowing for computational parallelism and system extensibility. WRF is suitable for a broad spectrum of applications across scales ranging from meters to thousands of kilometers.
Additional Information:
The WRF model is currently run at the
National Weather Service Forecast Office in Jacksonville over the
Suwannee Watershed as a result of the NOAA Coastal Storms Initiative.
The University of North Florida expects to be running WRF within a year
over a significantly larger domain, and for 48 hours as a daily
high-resolution (4 km) FL/GA convective rain and tropical storm model.
The WRF model has been shown to produce more accurate wind, convective
rain, and tropical storm structure. See: WRF http://www.wrf-model.org/index.php
(Under session 2 Welsh and Bogenschutz, Davis et al.)
Extreme Events
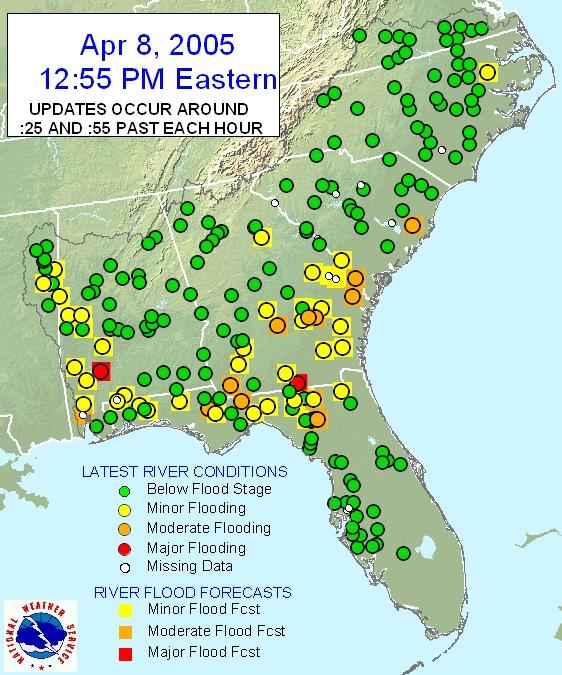 Flood Warning - NWS Southeast River Forecast Center
See http://www.srh.noaa.gov/serfc/?n=river
Water level records:
- SRWMD – all water levels
- NWS – existing water levels
- USGS – historic water levels
 Hurricane Warning - NWS
Tropical Prediction Center - National Hurricane Center
Hurricane Warning - NWS
Tropical Prediction Center - National Hurricane Center
Historical Climate Records
University of Central Florida http://library.ucf.edu/GovDocs/climate/climatefl.php
NCDC archives http://lwf.ncdc.noaa.gov/oa/ncdc.html
Future Projects
The U.S. Climate Reference Network (USCRN)
The U.S. Climate Reference Network (USCRN) is a network of climate stations now being developed as part of a National Oceanic and Atmospheric Administration (NOAA) initiative. Its primary goal is to provide future long-term homogeneous observations of temperature and precipitation that can be coupled to long-term historical observations for the detection and attribution of present and future climate change. Data from the USCRN will be used in operational climate monitoring activities and for placing current climate anomalies into an historical perspective. The USCRN will also provide the United States with a reference network that meets the requirements of the Global Climate Observing System (GCOS). If fully implemented, the network will consist of about 110 stations nationwide. Implementation of the USCRN is contingent on the availability of funding. $200,00 per site.
Additional Information:
Mesonet
 The Meteorological Assimilation Data Ingest System MADIS subscribers
have access to an integrated, reliable and easy-to-use database
containing the real-time and archived observational datasets described
below. Also available are real-time gridded surface analyses that
assimilate all of the MADIS surface datasets (including the highly-dense
integrated mesonet data). http://www-sdd.fsl.noaa.gov/MADIS/ and http://www-sdd.fsl.noaa.gov/MADIS/madis_datasets.html
The Meteorological Assimilation Data Ingest System MADIS subscribers
have access to an integrated, reliable and easy-to-use database
containing the real-time and archived observational datasets described
below. Also available are real-time gridded surface analyses that
assimilate all of the MADIS surface datasets (including the highly-dense
integrated mesonet data). http://www-sdd.fsl.noaa.gov/MADIS/ and http://www-sdd.fsl.noaa.gov/MADIS/madis_datasets.html
For MADIS data plotting: http://www-frd.fsl.noaa.gov/mesonet/