Santa Fe Sub-Basin Critical Zone Observatory
See other maps and data at Santa Fe WATERS testbed page
Map Images
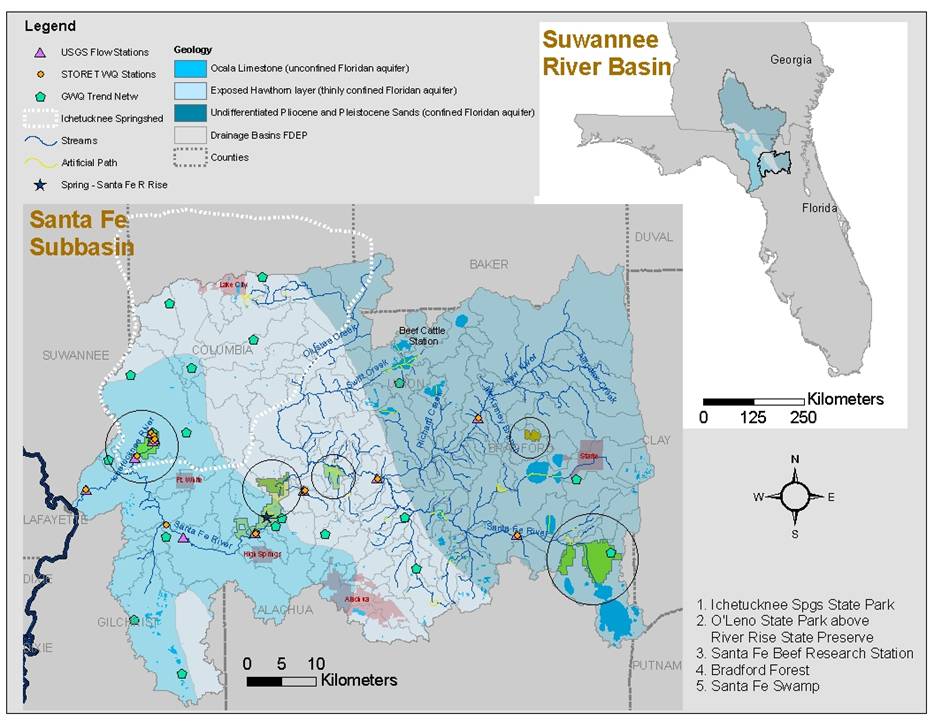
- CZO field sites - land use / land cover in Santa Fe basin
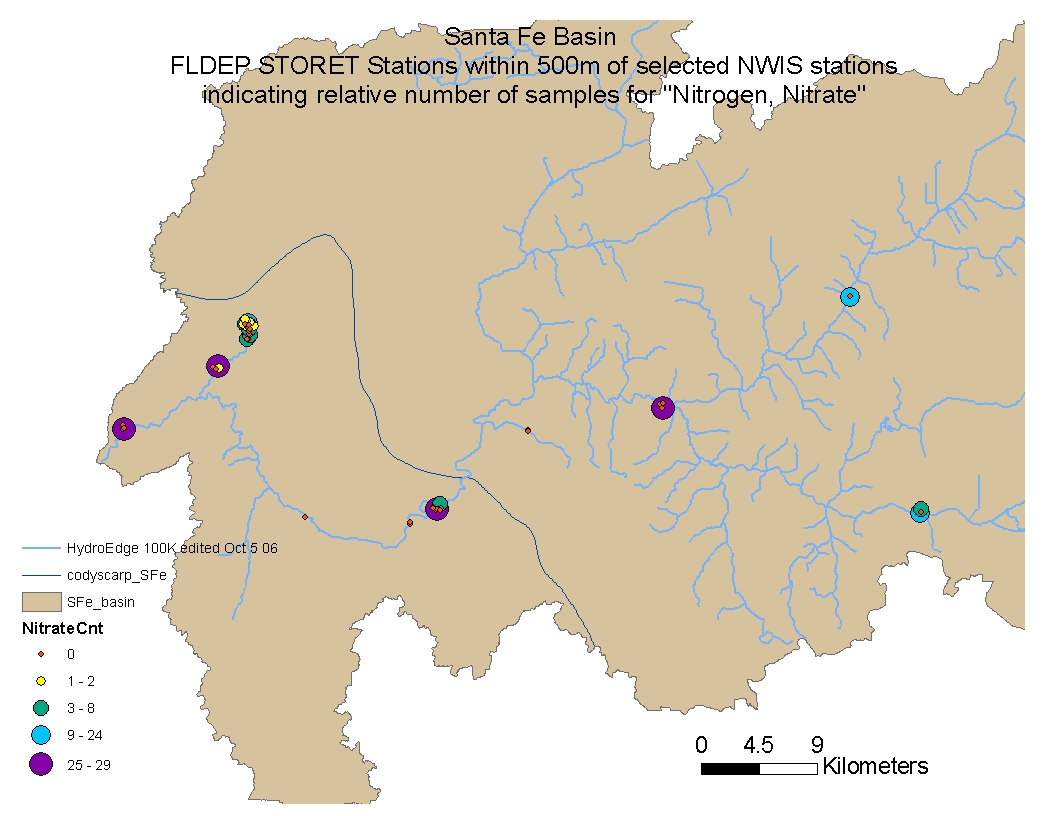
- Image nitrate count (jpg)
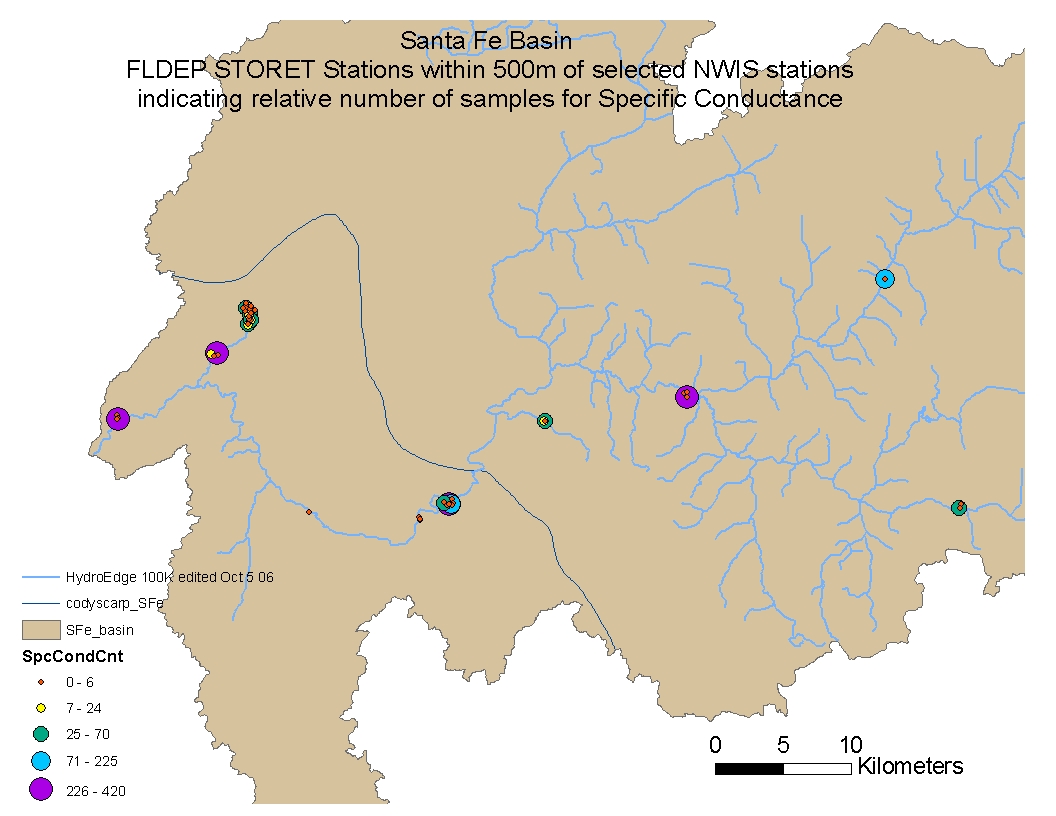
- Image specific conductance count (jpg)
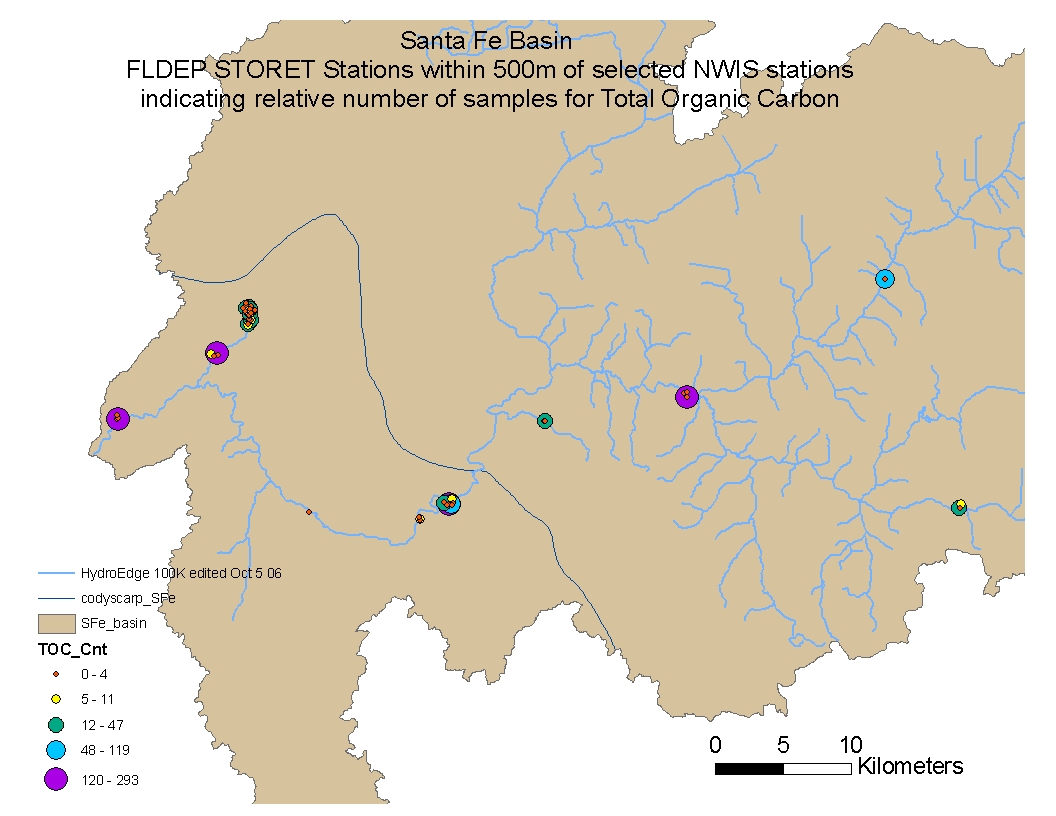
- Image TOC count (jpg)
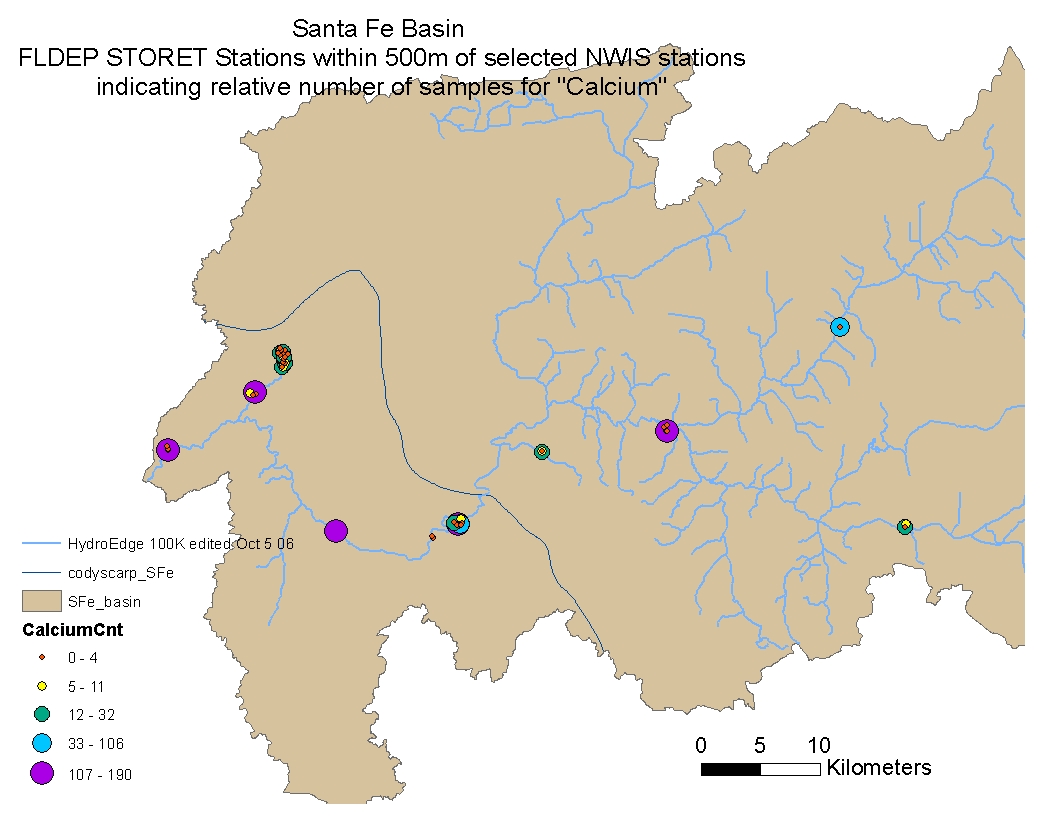
- Image calcium count (jpg)
Time Series Data for Download
Flow vs. Water Quality
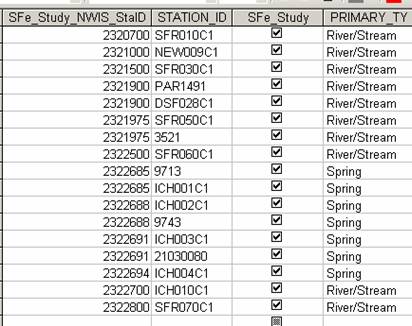
Table showing which USGS flow stations (column 1, pink triangles in map) were compared to which EPA STORET water quality stations (column 2, orange dots in map)
Excel Sheets and Graphs of flow vs. water quality:
- Chloride (708KB xls) (dec. 13)
- Total P (700KB xls) (dec. 13)
- Calcium (720KB xls) (dec. 13)
- Nitrate (1MB xls) (dec. 13)
- Fluoride (986KB xls) (dec. 13)
- TOC (1MB xls) (dec. 13)
- Alkalinity (999KB xls) (dec. 13)
- Specif Conduct (1MB xls) (dec. 13)
Zipped Excel Sheets with Graphs
- Diss Oxyg (dec. 13) (185KB zip)
- Magnesium (dec. 13) (189KB zip)
- Orthophosphate (dec. 13) (201KB zip)
- TSS (dec. 13) (790KB zip)
- Temperature (dec. 13) (1MB zip)
- Sodium (dec. 13) (1MB zip)
- pH (dec. 13) (1MB zip)